POIs Analysis

The POI analysis was conducted by intersecting pre-defined polygons representing various Polygons of Interest (POIs) with the movement data. This allowed us to isolate mobility patterns specific to each POI. The intersected data was then divided into seven distinct COVID-19 phases for temporal analysis. For each polygon within a phase, the movement data was aggregated, and the mean values were calculated. This approach enabled a detailed examination of mobility trends and changes across different POI categories, providing insights into how urban activity evolved during the pandemic.


Mean Values of every POI Type

Mean Values of POIs

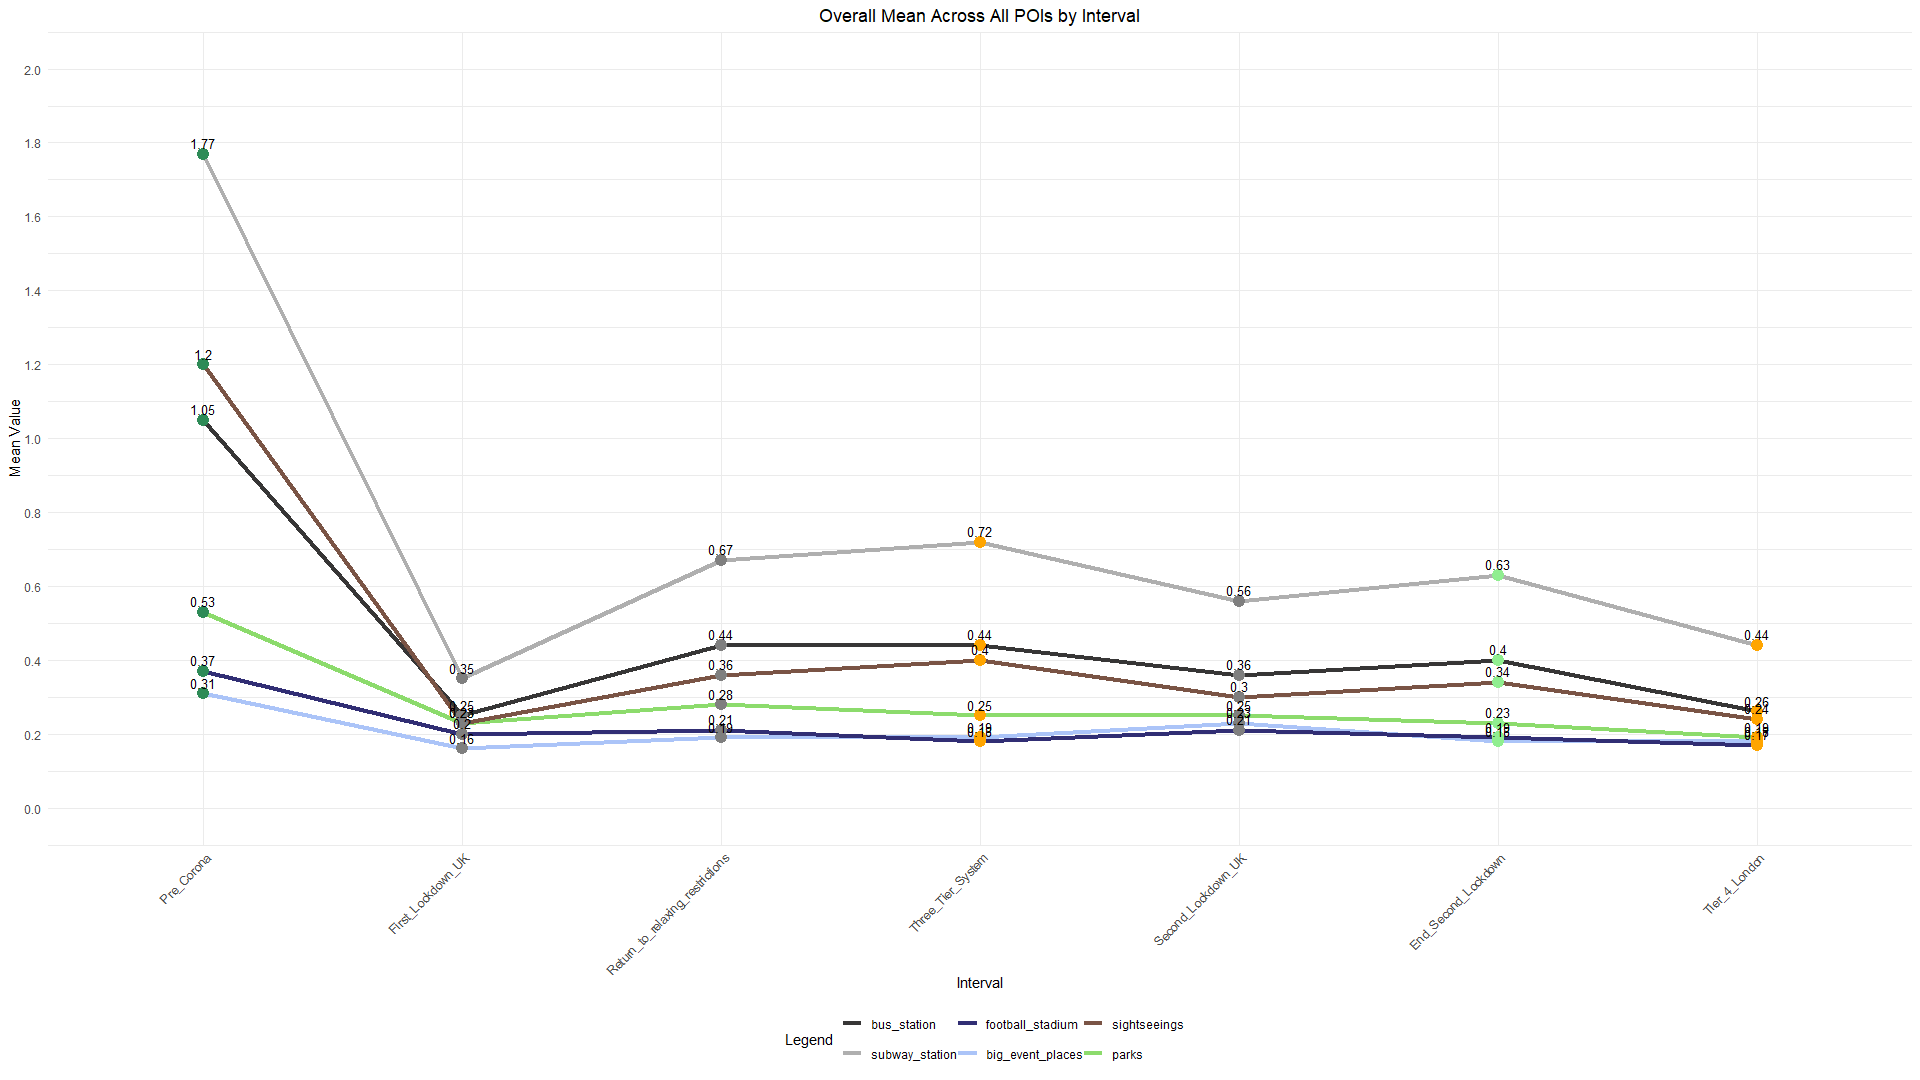
During the Pre-Corona phase, activity levels are highest across all POIs, particularly for bus stations and football stadiums, which show the most significant decline during the First Lockdown. In the Relaxing Restrictions phase, recovery is evident across most POIs, though the levels remain below Pre-Corona values. Notably, parks display smaller reductions in activity during lockdowns compared to other categories, likely due to their role as outdoor leisure spaces. Big event places and football stadiums, however, exhibit a minimal recovery, reflecting ongoing restrictions on large gatherings. Subsequent phases like the Three-Tier System and End of Second Lockdown show relatively stable trends for most POIs, with a gradual recovery in activity for bus stations and subway stations. The Tier 4 phase again reveals a slight decline in activity, particularly for parks and bus stations, indicating the reintroduction of stricter measures. Overall, the chart highlights significant variation in recovery rates across POI categories, with outdoor spaces like parks maintaining steadier activity levels compared to indoor or event-based locations like stadiums and subway stations.


Mean Values of every Bus/Subway stations

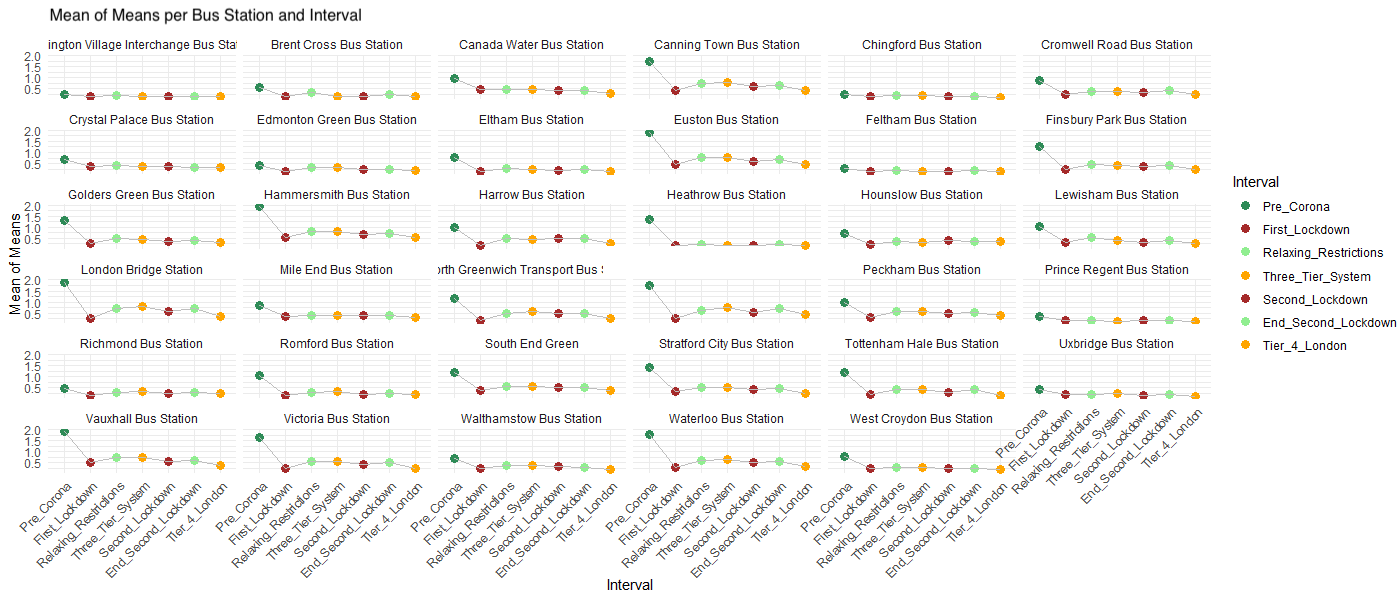
During the Pre-Corona phase, activity levels are consistently higher, as indicated by the elevated mean values. However, during the First Lockdown, activity levels drop noticeably, reflecting the impact of restrictions on mobility. As restrictions ease during the Relaxing Restrictions phase, a partial recovery in activity is observed at most bus stations, though the levels remain lower compared to the Pre-Corona phase. Subsequent phases, such as the Three-Tier System and Second Lockdown, show fluctuating but generally subdued activity. Overall there is a strong decline during restrictive periods and slight recovery during relaxation phases.


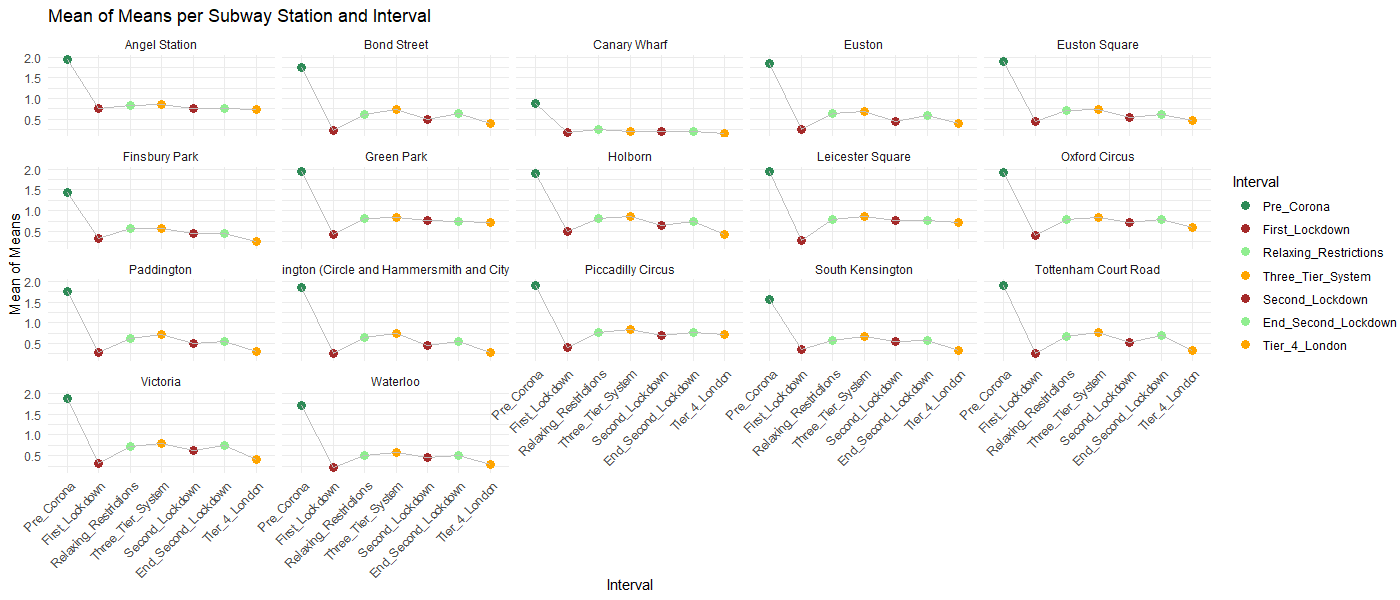
Compared to the bus station chart, the subway station chart reveals similar trends in activity reduction during COVID-19 intervals but with some notable differences. While both types of stations show significant drops during the First Lockdown, the decline at subway stations appears steeper and more uniform, suggesting a heavier reliance on buses for essential travel during this period.


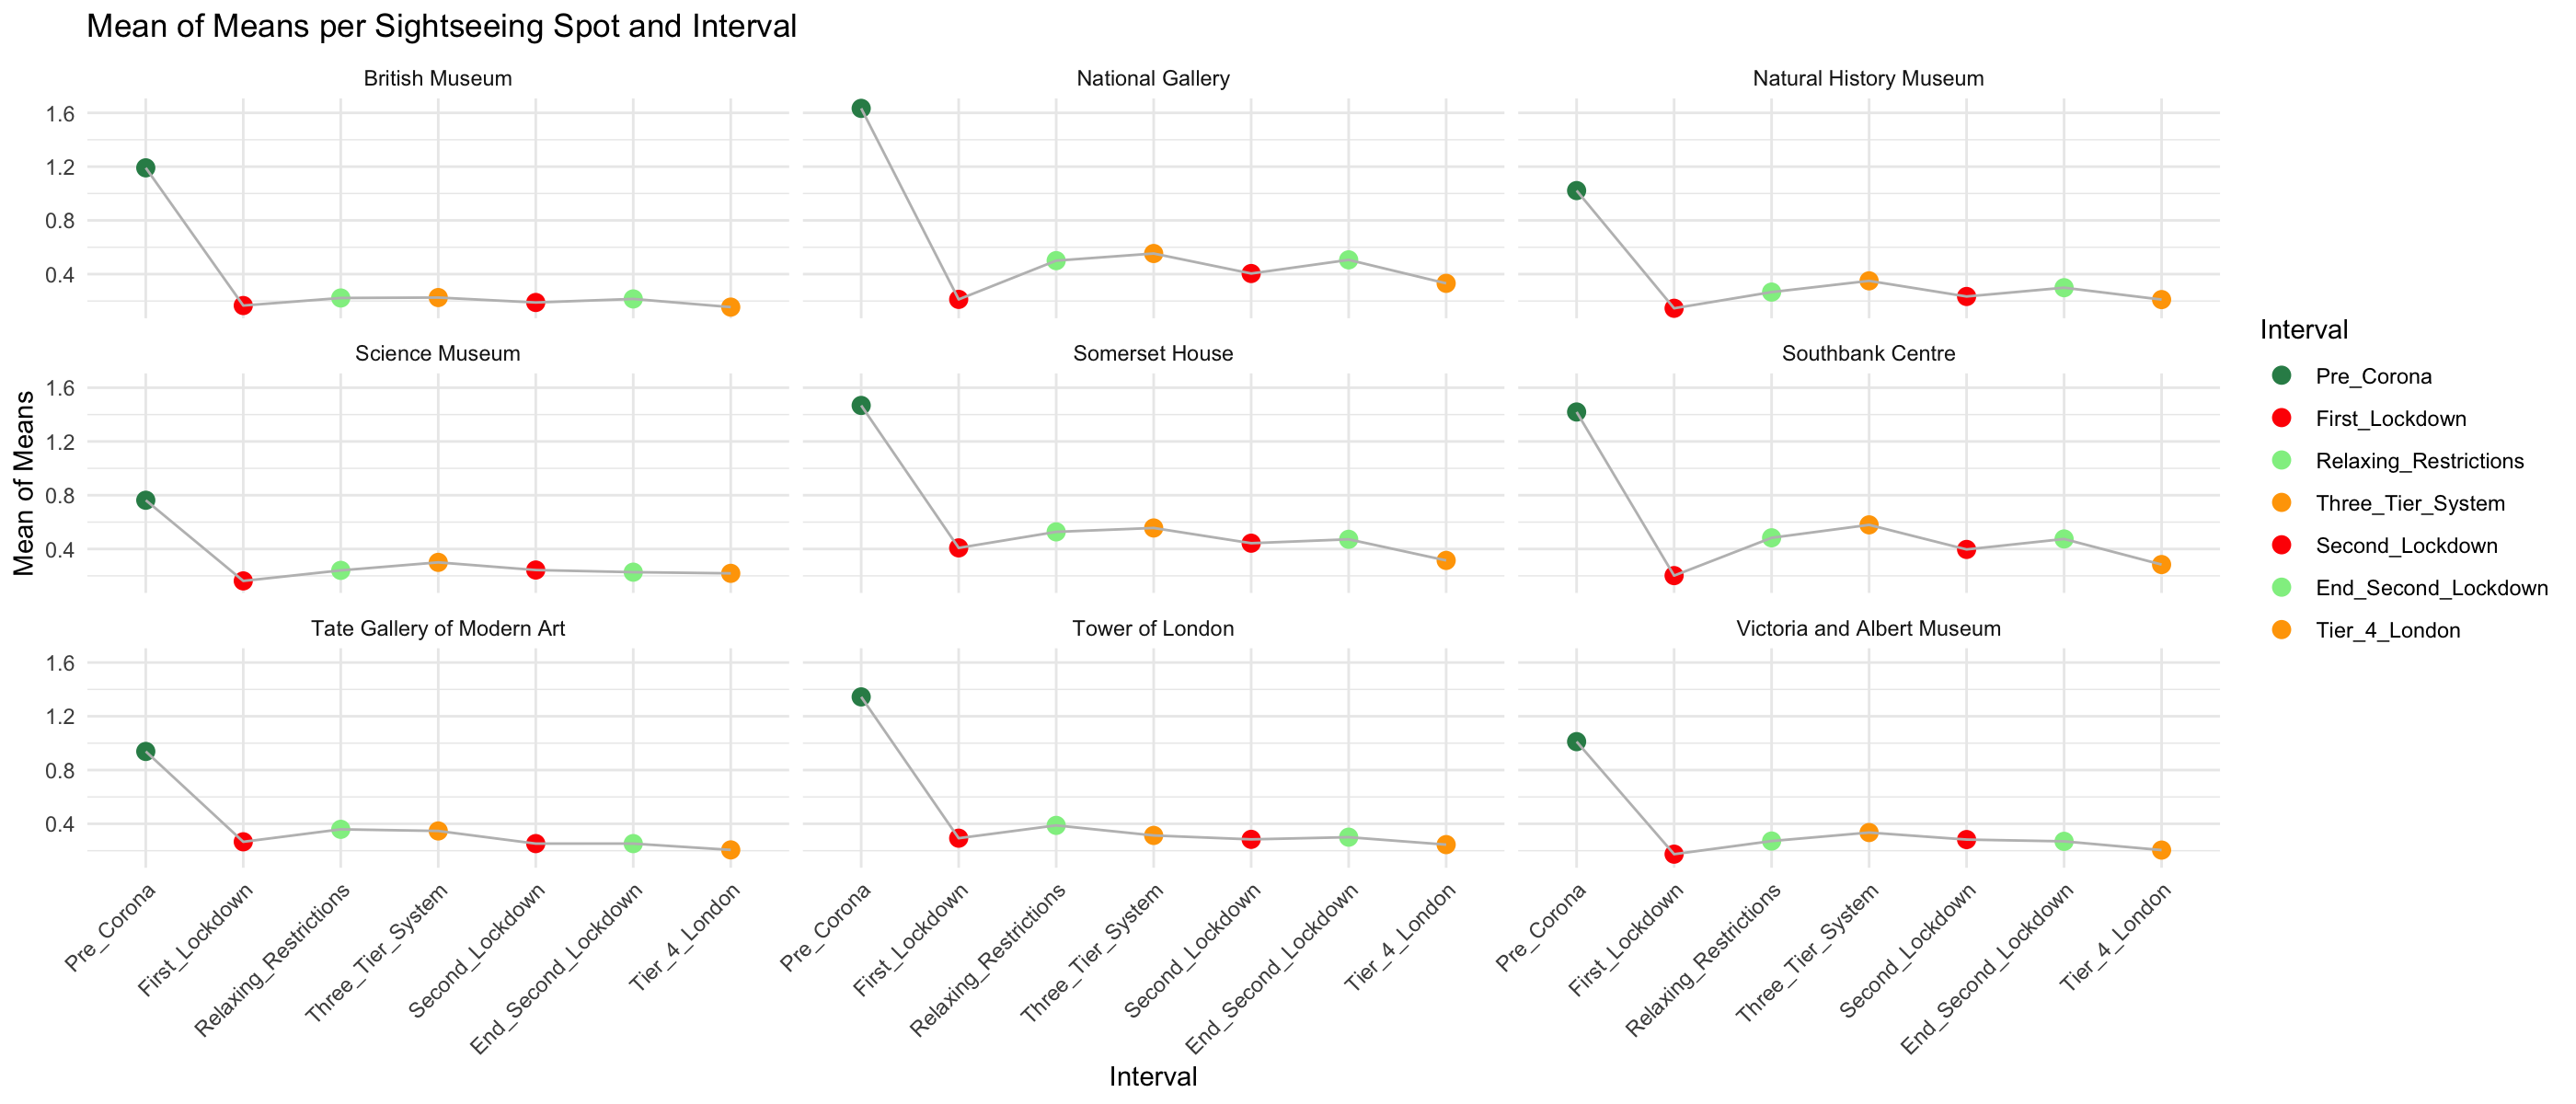
Compared to other POI categories, sightseeing spots show a steep and lasting decline in activity during COVID-19 intervals. While all locations experienced a sharp drop during the First Lockdown, their recovery remained slow and inconsistent. Unlike the transportation hubs, which adapted more quickly, major landmarks such as the British Museum and Tower of London saw prolonged low activity, reflecting restrictions on tourism and indoor venues. Even in later phases like the Three-Tier System and Tier 4, activity levels remained far below Pre-Corona values, highlighting the pandemic’s lasting impact on cultural and historical sites.


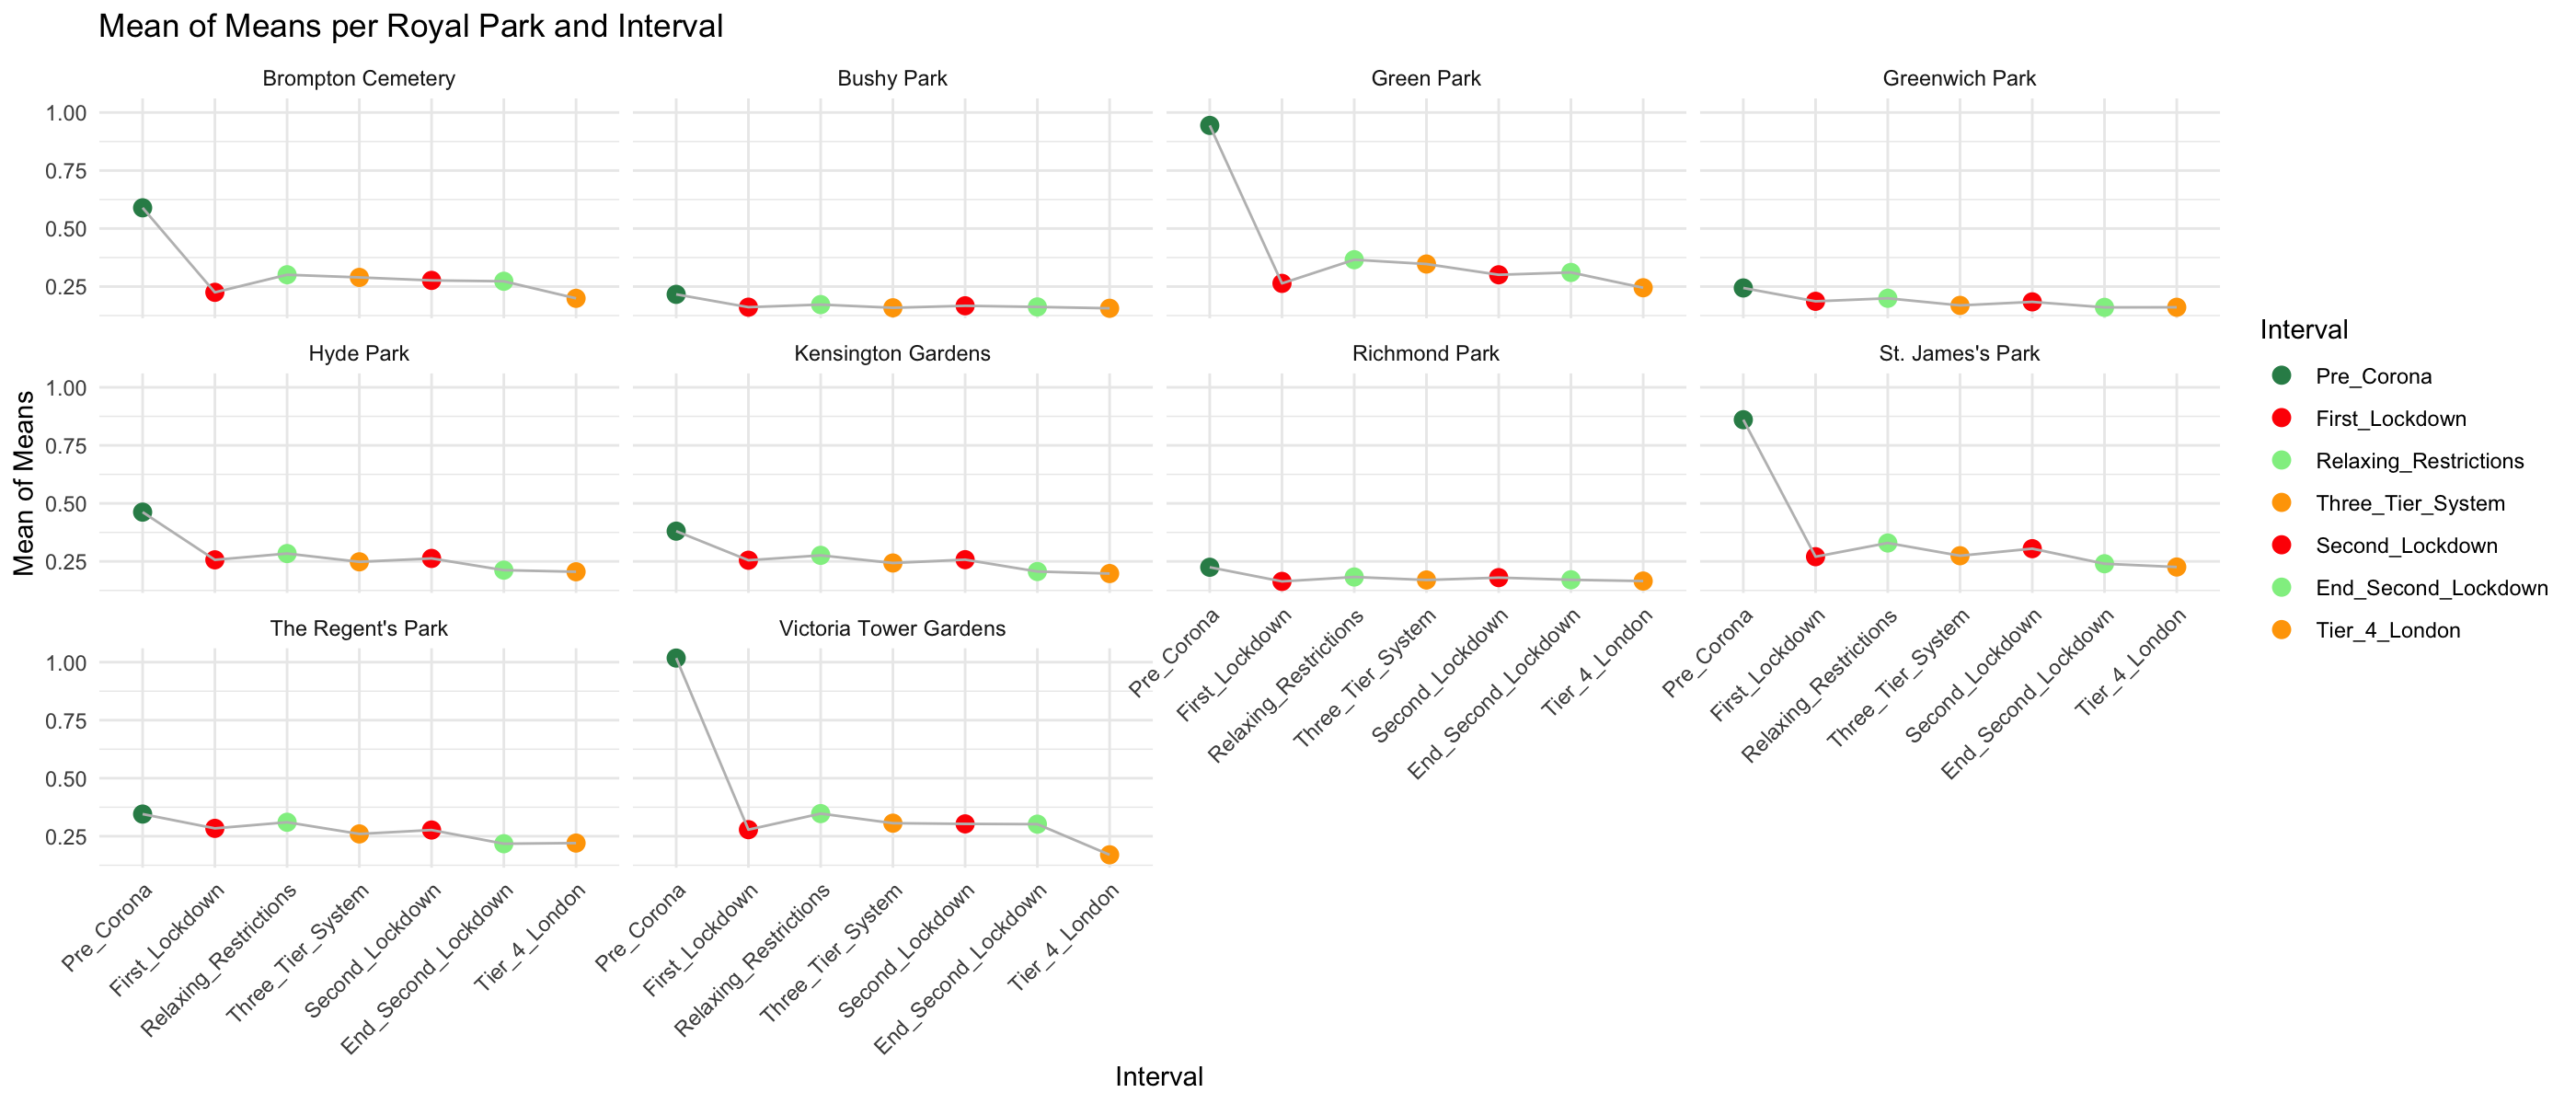
Compared to other POI categories, Royal Parks showed greater resilience during COVID-19 intervals. While activity dropped during the First Lockdown, parks remained accessible, leading to a steadier recovery during Relaxing Restrictions. However, Brompton Cemetery, Green Park, St. James’s Park, and Victoria Tower Gardens experienced a significantly stronger decline than other parks, with lower recovery in later phases. Unlike larger parks like Hyde Park or Regent’s Park, their activity remained suppressed, highlighting varying usage patterns among green spaces.


Daily averages of Game/Eventdays

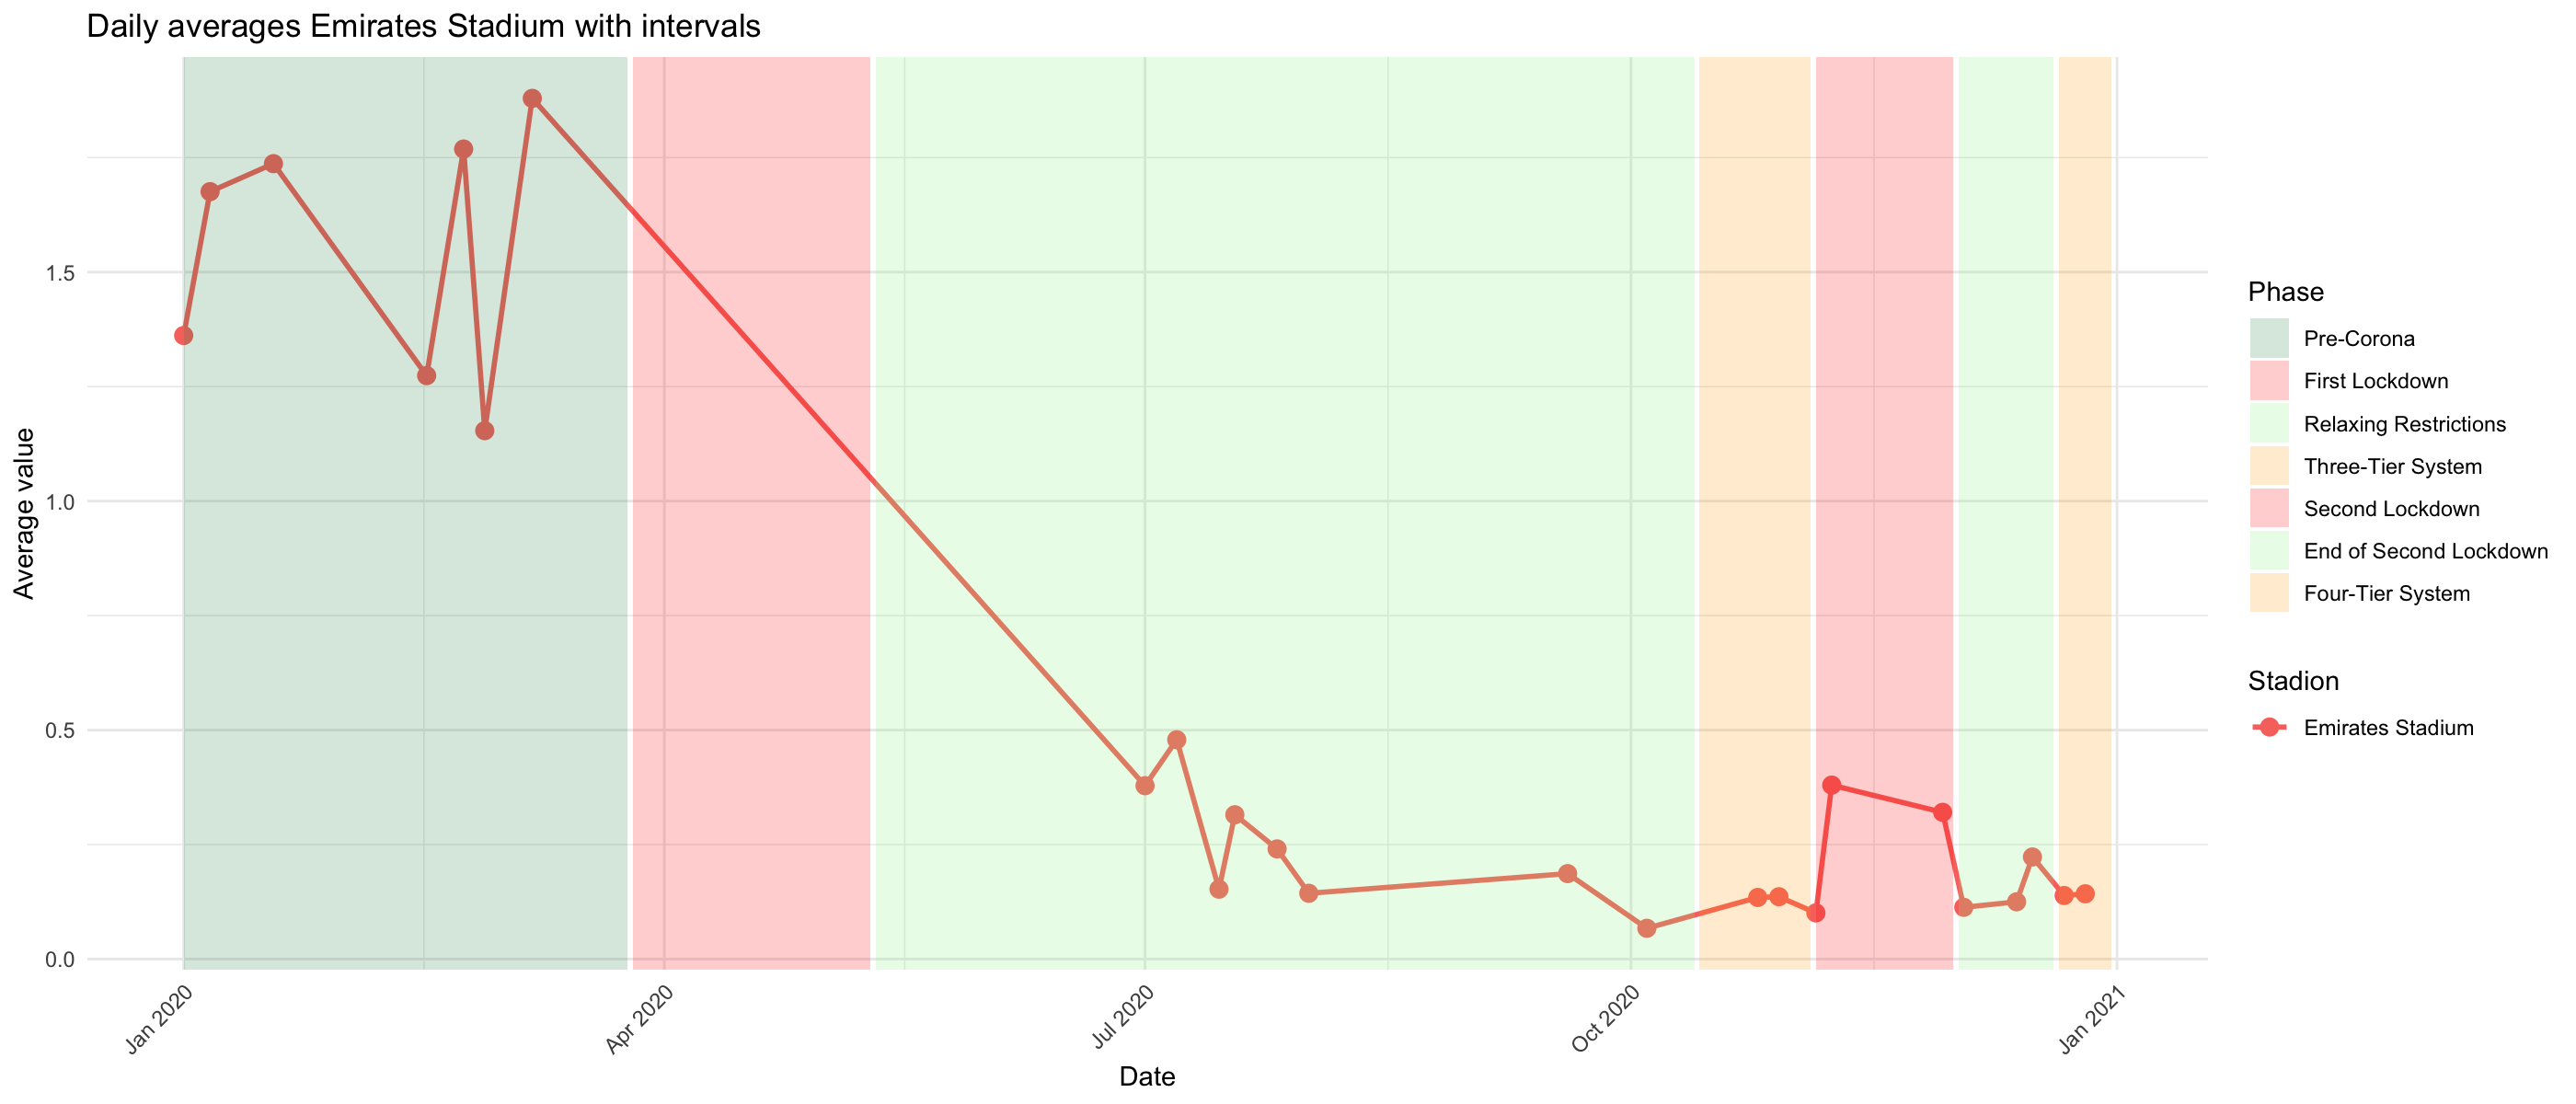
The match schedule for Arsenal in 2020 provides valuable context for the observed activity trends at the Emirates Stadium. During the Pre-Corona phase, regular matches such as Arsenal vs. Manchester United and Arsenal vs. West Ham contributed to the high activity levels, as fans attended games without restrictions. However, the First Lockdown from March to June 2020 saw a complete suspension of football matches, which aligns with the sharp decline in activity during this period. As restrictions eased in the Relaxing Restrictions phase, matches resumed in July 2020, including Arsenal vs. Norwich and Arsenal vs. Liverpool. Despite the return of games, attendance was limited or prohibited, resulting in only a partial recovery in activity levels. During the subsequent phases, such as the Three-Tier System and Second Lockdown, matches continued, including high-profile games like Arsenal vs. Chelsea and Arsenal vs. Southampton, but fan restrictions led to consistently low activity at the stadium. Later in the year, Europa League matches, such as Arsenal vs. FC Dundalk and Arsenal vs. Rapid Wien, were held at the Emirates Stadium. However, these events also failed to significantly boost activity levels due to ongoing restrictions on spectators.


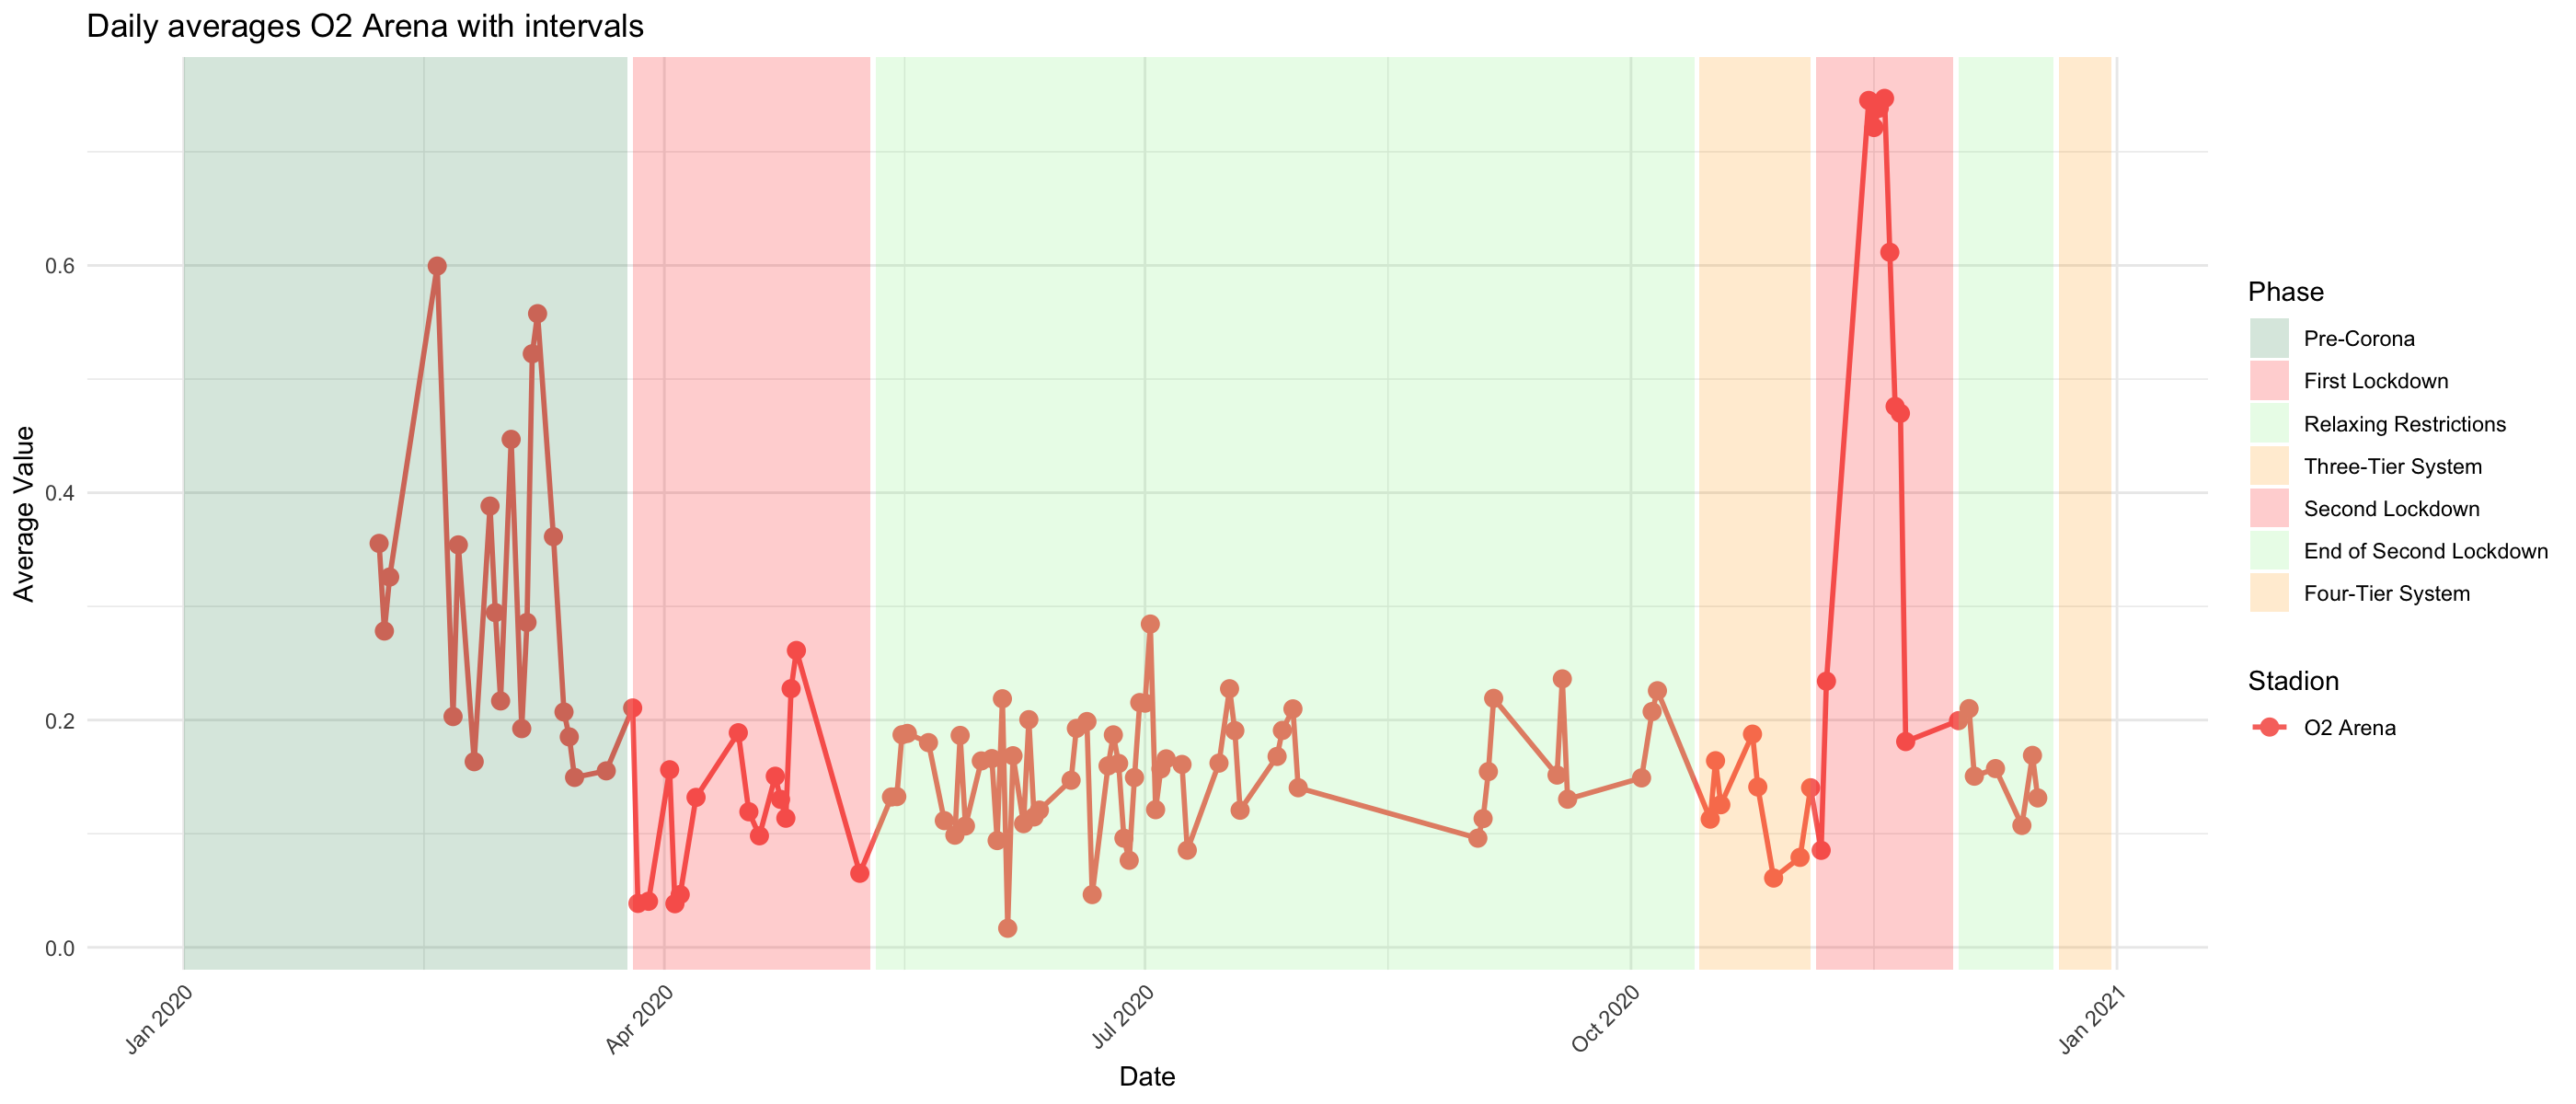
During the Pre-Corona phase, activity levels were relatively high, driven by a full schedule of events, including performances by The 1975, The Script, and Strictly Come Dancing. These events attracted large audiences and contributed to consistent activity at the arena. However, with the onset of the First Lockdown in March 2020, all events were canceled or postponed, leading to a sharp decline in activity. Performances by Santana, Maluma, and Cirque du Soleil were among those impacted, resulting in near-zero activity levels during this period. As restrictions eased during the Relaxing Restrictions phase, activity partially resumed, though it remained modest compared to Pre-Corona levels. Smaller-scale events and preparations for future shows contributed to this slight recovery. During the Three-Tier System and Second Lockdown phases, activity remained subdued due to ongoing restrictions and limited attendance. Events like Elton John's concerts were postponed, and the arena operated at minimal capacity. At the end of 2020, activity peaked briefly during the Nitto ATP Finals and Elton John's rescheduled performances. However, this spike was short-lived, and activity quickly declined again as restrictions persisted.


Results and Interpretation

The POI analysis highlights the spatial and temporal dynamics of human activity at specific Polygons of Interest (POIs) during different phases of the COVID-19 pandemic. By examining aggregated activity data for categories such as bus stations, subway stations, parks, football stadiums, and big event venues, several key insights emerge. During the Pre-Corona phase, activity levels were consistently high across most POIs, reflecting regular urban mobility patterns. Locations like bus stations, subway stations, and football stadiums served as key hubs, exhibiting strong clustering of activity.

In the lockdown phases, a significant reduction in activity was observed across nearly all POI categories. Big event venues and football stadiums experienced the sharpest declines due to event cancellations and restrictions on large gatherings. Parks, however, displayed a relatively smaller decrease, highlighting their importance as essential outdoor spaces for recreation. As restrictions eased during the Relaxing Restrictions and Recovery phases, a partial recovery in activity levels was noted, particularly at transportation hubs like bus and subway stations. Big event venues and football stadiums, however, showed limited recovery as attendance remained restricted. Parks maintained steadier activity levels compared to other categories, reflecting a shift in human behavior toward outdoor activities.

The analysis also reveals distinct activity patterns within each POI category. Parks and transportation hubs adapted more quickly to relaxed measures, whereas event-based venues showed prolonged declines. This underscores the varying levels of resilience among POI categories to mobility disruptions. Overall, the POI analysis highlights the significant impact of COVID-19 on urban mobility and activity. Transportation and outdoor spaces showed greater adaptability, while event-based venues faced sustained challenges. These insights provide a valuable basis for planning urban recovery strategies and prioritizing infrastructure resilience in response to future disruptions.

The following key observations stand out:

These observations underscore the varied impacts of COVID-19 on different POI categories and the importance of resilience planning for future urban disruptions.