Results and Interpretation
The Moran's I analysis, incorporating both global and local perspectives, highlights dynamic spatial patterns and their evolution across different time intervals during the pandemic.
These patterns reveal significant insights into the clustering of activities and variations in key areas such as roads and Points of Interest (POIs).
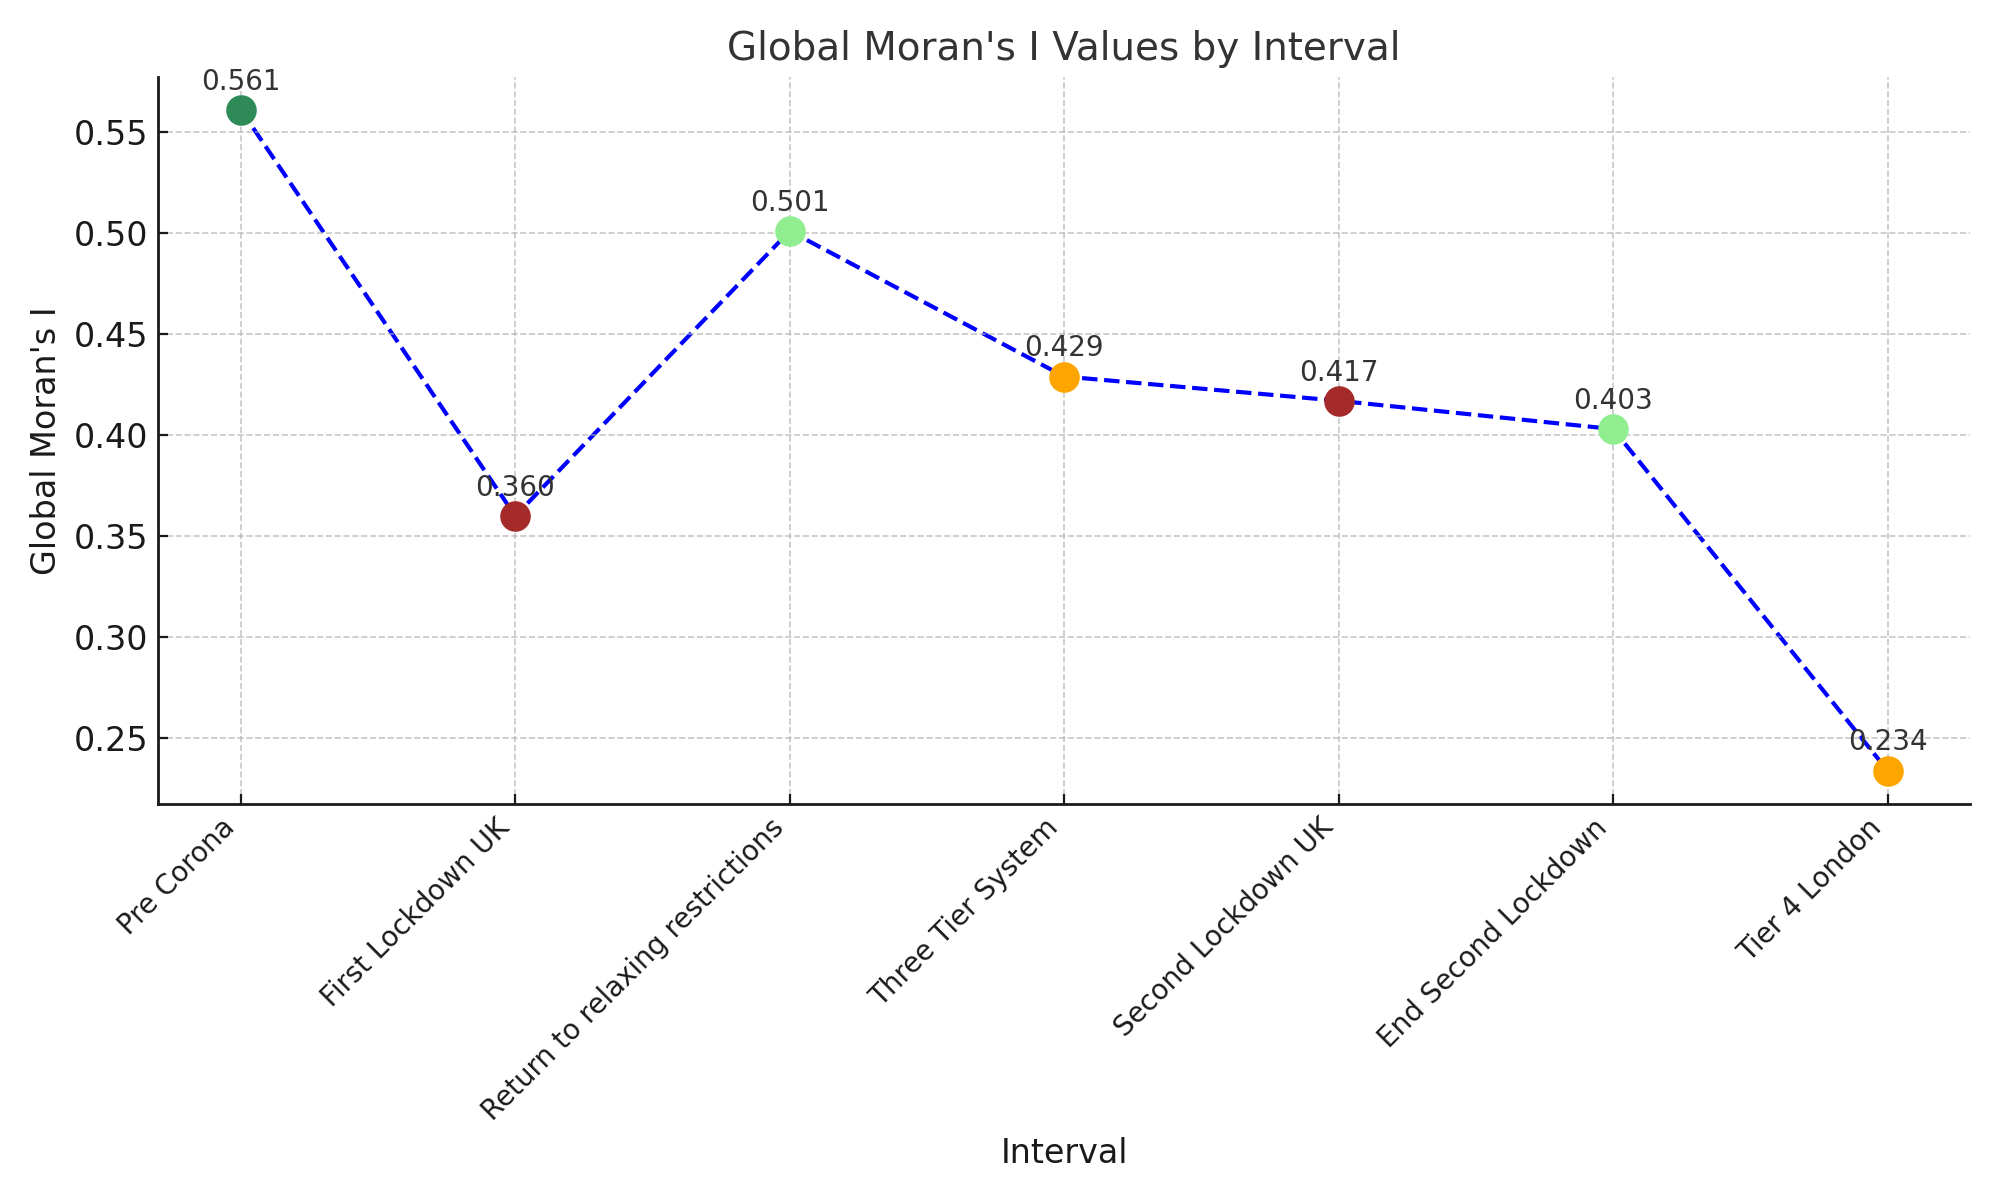
Global Moran's I values consistently show higher spatial autocorrelation during the Pre-Corona period and relaxation phases, indicating strong clustering of activities in urban centers and hotspots.
Conversely, during lockdown phases, the values decline, reflecting a reduction in clustering and the homogenization of spatial patterns as mobility decreased.
Local Moran's I reveals finer details, highlighting specific areas where spatial clusters (hotspots and cold spots) occur. Negative Moran's I values, often observed around roads, suggest contrasting activity patterns between roads and surrounding areas.
POIs such as bus depots and subway stations frequently appear in these negative-value zones, particularly during the Pre-Corona and Relaxation phases, underlining their distinct roles in the spatial activity landscape.
The following key observations stand out:
- Pre-Corona and Relaxation Phases: Clear hotspots of activity in urban areas, with roads and POIs showing significant contrasts.
- Lockdown Phases: A shift toward more uniform spatial patterns, with reduced clustering in urban centers and POIs, and pronounced negative Moran's I values near roads.
- Recovery Phases: Gradual re-emergence of positive clusters as activity normalizes, though some areas (e.g., roads and POIs) remain distinct outliers.
This comprehensive analysis demonstrates the utility of Moran's I in uncovering spatial dynamics over time. By integrating both global and local perspectives, it becomes possible to pinpoint significant variations and contrasts, offering actionable insights for understanding spatial activity patterns.