Spatio-Temporal Density-Based Spatial Clustering (ST-DBSCAN)
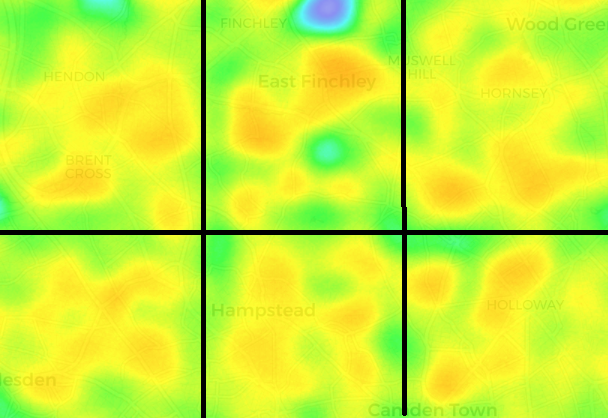
The Spatio-Temporal Density-Based Spatial Clustering of Applications with Noise (ST-DBSCAN), is a clustering algorithm that integrates both spatial and temporal dimensions. Applied to London’s movement data with the predefined time intervals, ST-DBSCAN was used in this project to identify patterns across the different time intervals. Three specific examples were selected to demonstrate how movement clusters manifest in different types of urban areas.
A button interface enables navigation through the selected time intervals, which allows the visualisation of movement patterns in the different locations. Each interval spans 20 days, which was done to maintain computational feasibility. The analysis focused on three areas: Greenwich, Westminster, and Regent's Park with the London Zoo. A spatial search radius of 66 meters was employed to detect clusters. Despite hardware limitations that restricted extensive parameter testing, several effective clusters were identified, that will be explained in the following.
▶ Westminster

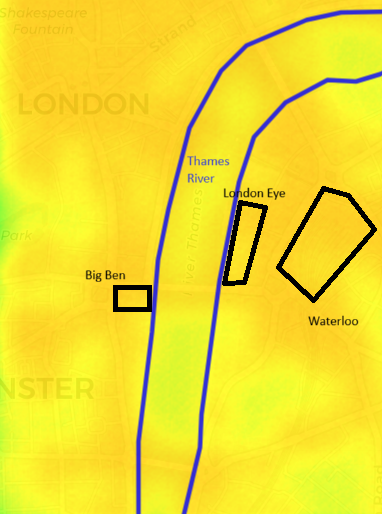
Westminster Area: This example covers Westminster with the Thames River at its center. Movement is concentrated along the bridges, which form clusters at the entry points, where people cross the river. Before COVID-19, clusters were spread throughout the area, especially near sightseeing spots like Big Ben and Waterloo. During the summer, with fewer restrictions, the number of clusters decreased but remained around tourist sites and Waterloo. During the strictest restrictions, there was a noticeable reduction in clusters, with only slight activity at the bridges and tourist spots, which is unusual for a busy area like Westminster.
▶ Greenwich

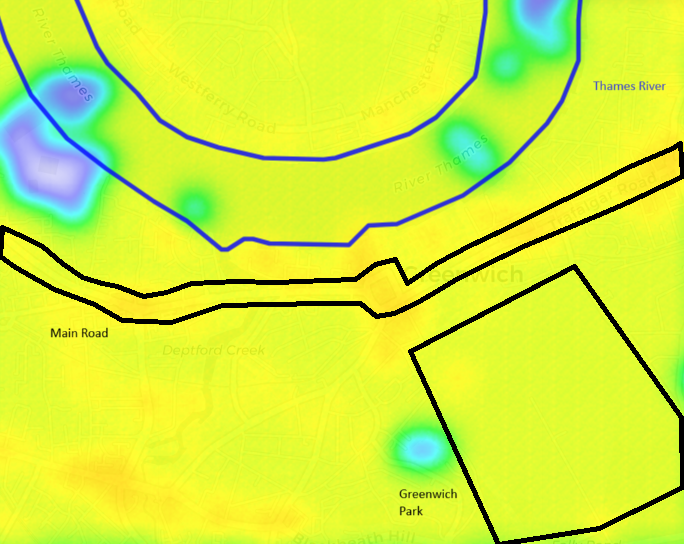
Greenwich Area: This example covers a section of Greenwich, including the A200 main road, the Thames River, and Greenwich Park. During the summer months with relaxed restrictions, movement patterns were more consistent. In the winter months with stricter conditions, movement along the streets, especially the main roads, decreased as fewer people commuted. The Thames River also showed less activity due to the absence of tourist boats. In contrast, Greenwich Park maintained steady levels of movement across different periods, indicating its continued use as an outdoor space despite the changing restrictions.
▶ Regent's Park (London Zoo)

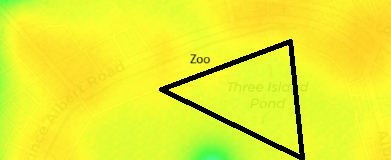
London Zoo: The ST-DBSCAN results for the London Zoo shows changes in visitor movement patterns across different time intervals. Before the pandemic, clusters indicate normal visitor activity. During the lockdown periods, all clusters disappear, reflecting the zoo's closure. This absence of activity contrasts with the surrounding areas, which still show some movement. As restrictions were eased, the zoo reopened with guidelines, leading to a return of clusters within its area.
